
Overview
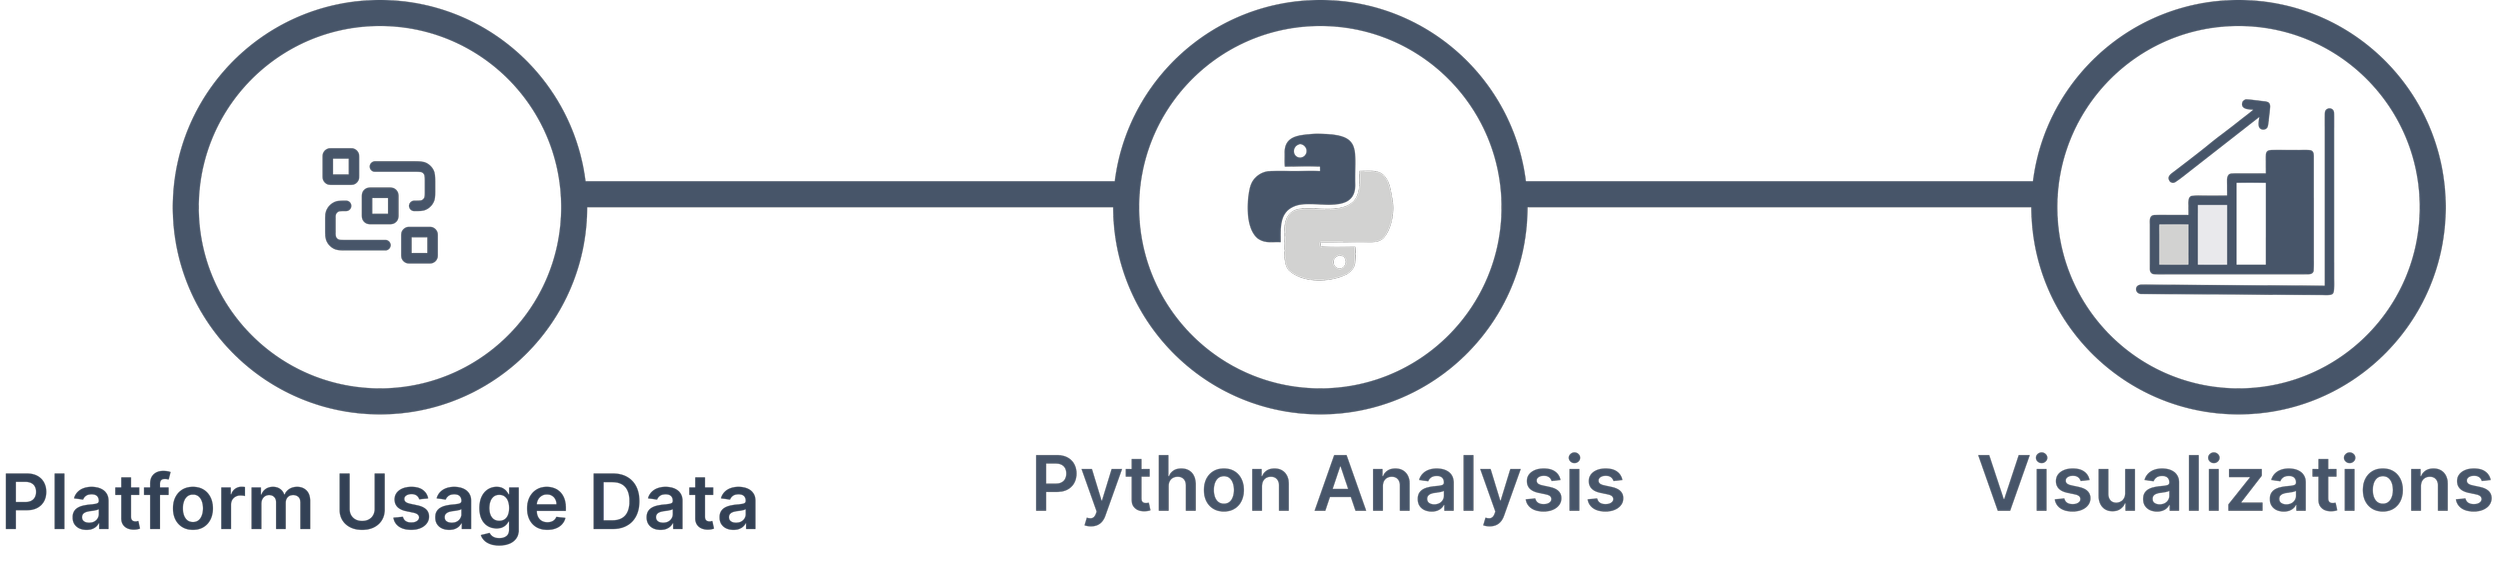
As part of a product analytics function, I designed and built an end-to-end client health scoring system that measures platform engagement across the full licensee base. The system ingests raw behavioural data from Pendo, runs it through an automated multi-step pipeline, and produces a set of 0–100 scores. These scores tell account teams how engaged each client is, how that compares to the rest of the base, and whether engagement is trending up or down.
The project spanned data engineering, statistical methodology, and stakeholder communication, from writing the Python pipeline to documenting the scoring model in plain language for non-technical audiences.
The Problem
With no systematic way to assess whether a client was getting meaningful value from the platform, account teams were working from intuition, anecdotal signals, and ad hoc data pulls, which made it hard to have data-backed conversations about adoption gaps.
The underlying data existed. Pendo was capturing feature-level engagement across hundreds of clients every month. But it lived in wide-format exports with inconsistent column naming, no product area grouping, and no normalization for account size. A large client with many users would always look more engaged than a smaller one, regardless of how deeply either was actually using the platform. There was no way to make a fair comparison.
The gap wasn't data, it was a structured way to turn that data into a signal that account teams could act on.
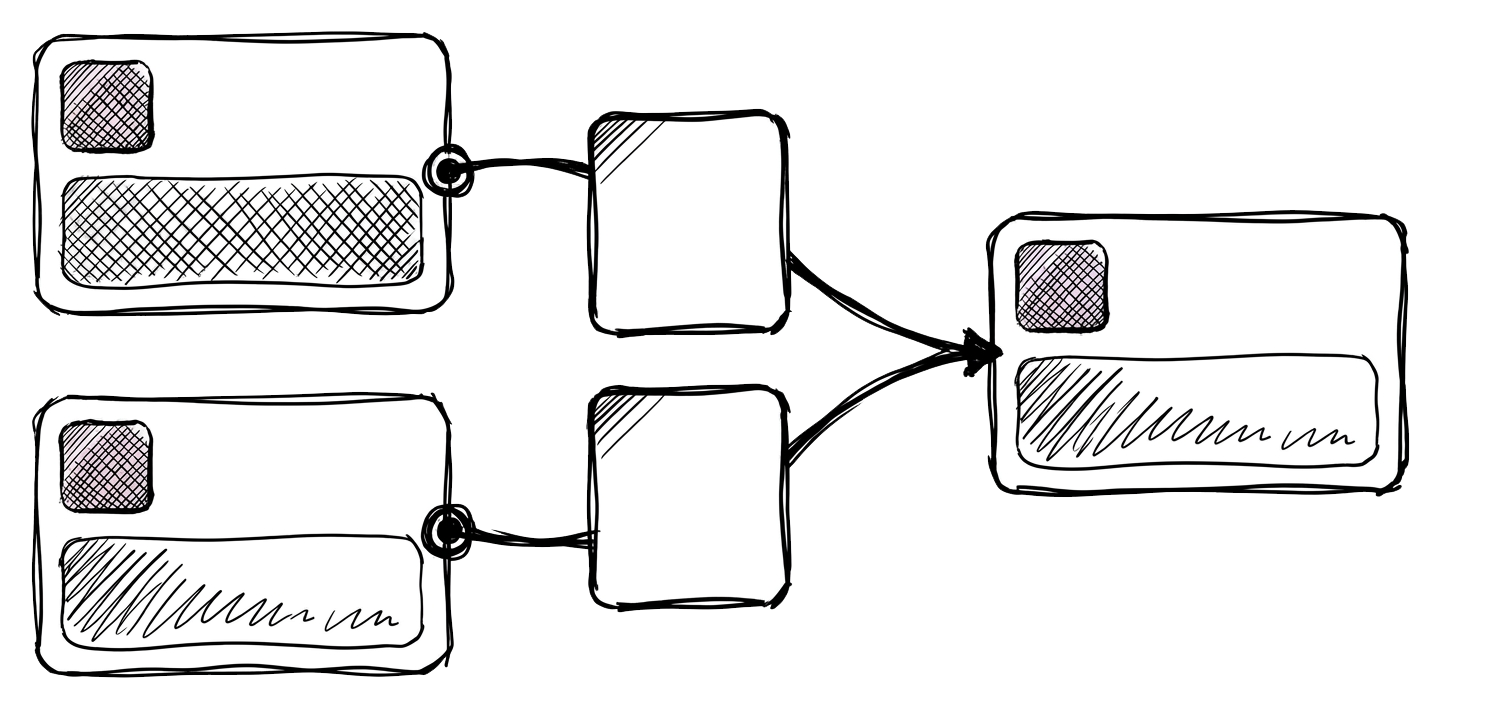
I built a five-step automated pipeline in Python that takes raw Pendo exports and produces a clean, analysis-ready scoring file with no manual intervention between steps.
The pipeline handles column standardization, metadata removal, a product area lookup join, engagement aggregation by client and month, and finally the index calculation itself. Each script is modular and can be run independently, but a single pipeline runner chains them in order and manages the folder structure automatically.
The scoring methodology was designed to solve the size-normalization problem directly. Rather than scoring on raw engagement volume, the score uses inverse coefficient of variation weighting across product areas, giving more weight to areas with consistent engagement signals across the base, and then converts the result to a percentile rank. A score of 70 means that licensee is more engaged than 70% of all clients, regardless of how many users they have.
Approach
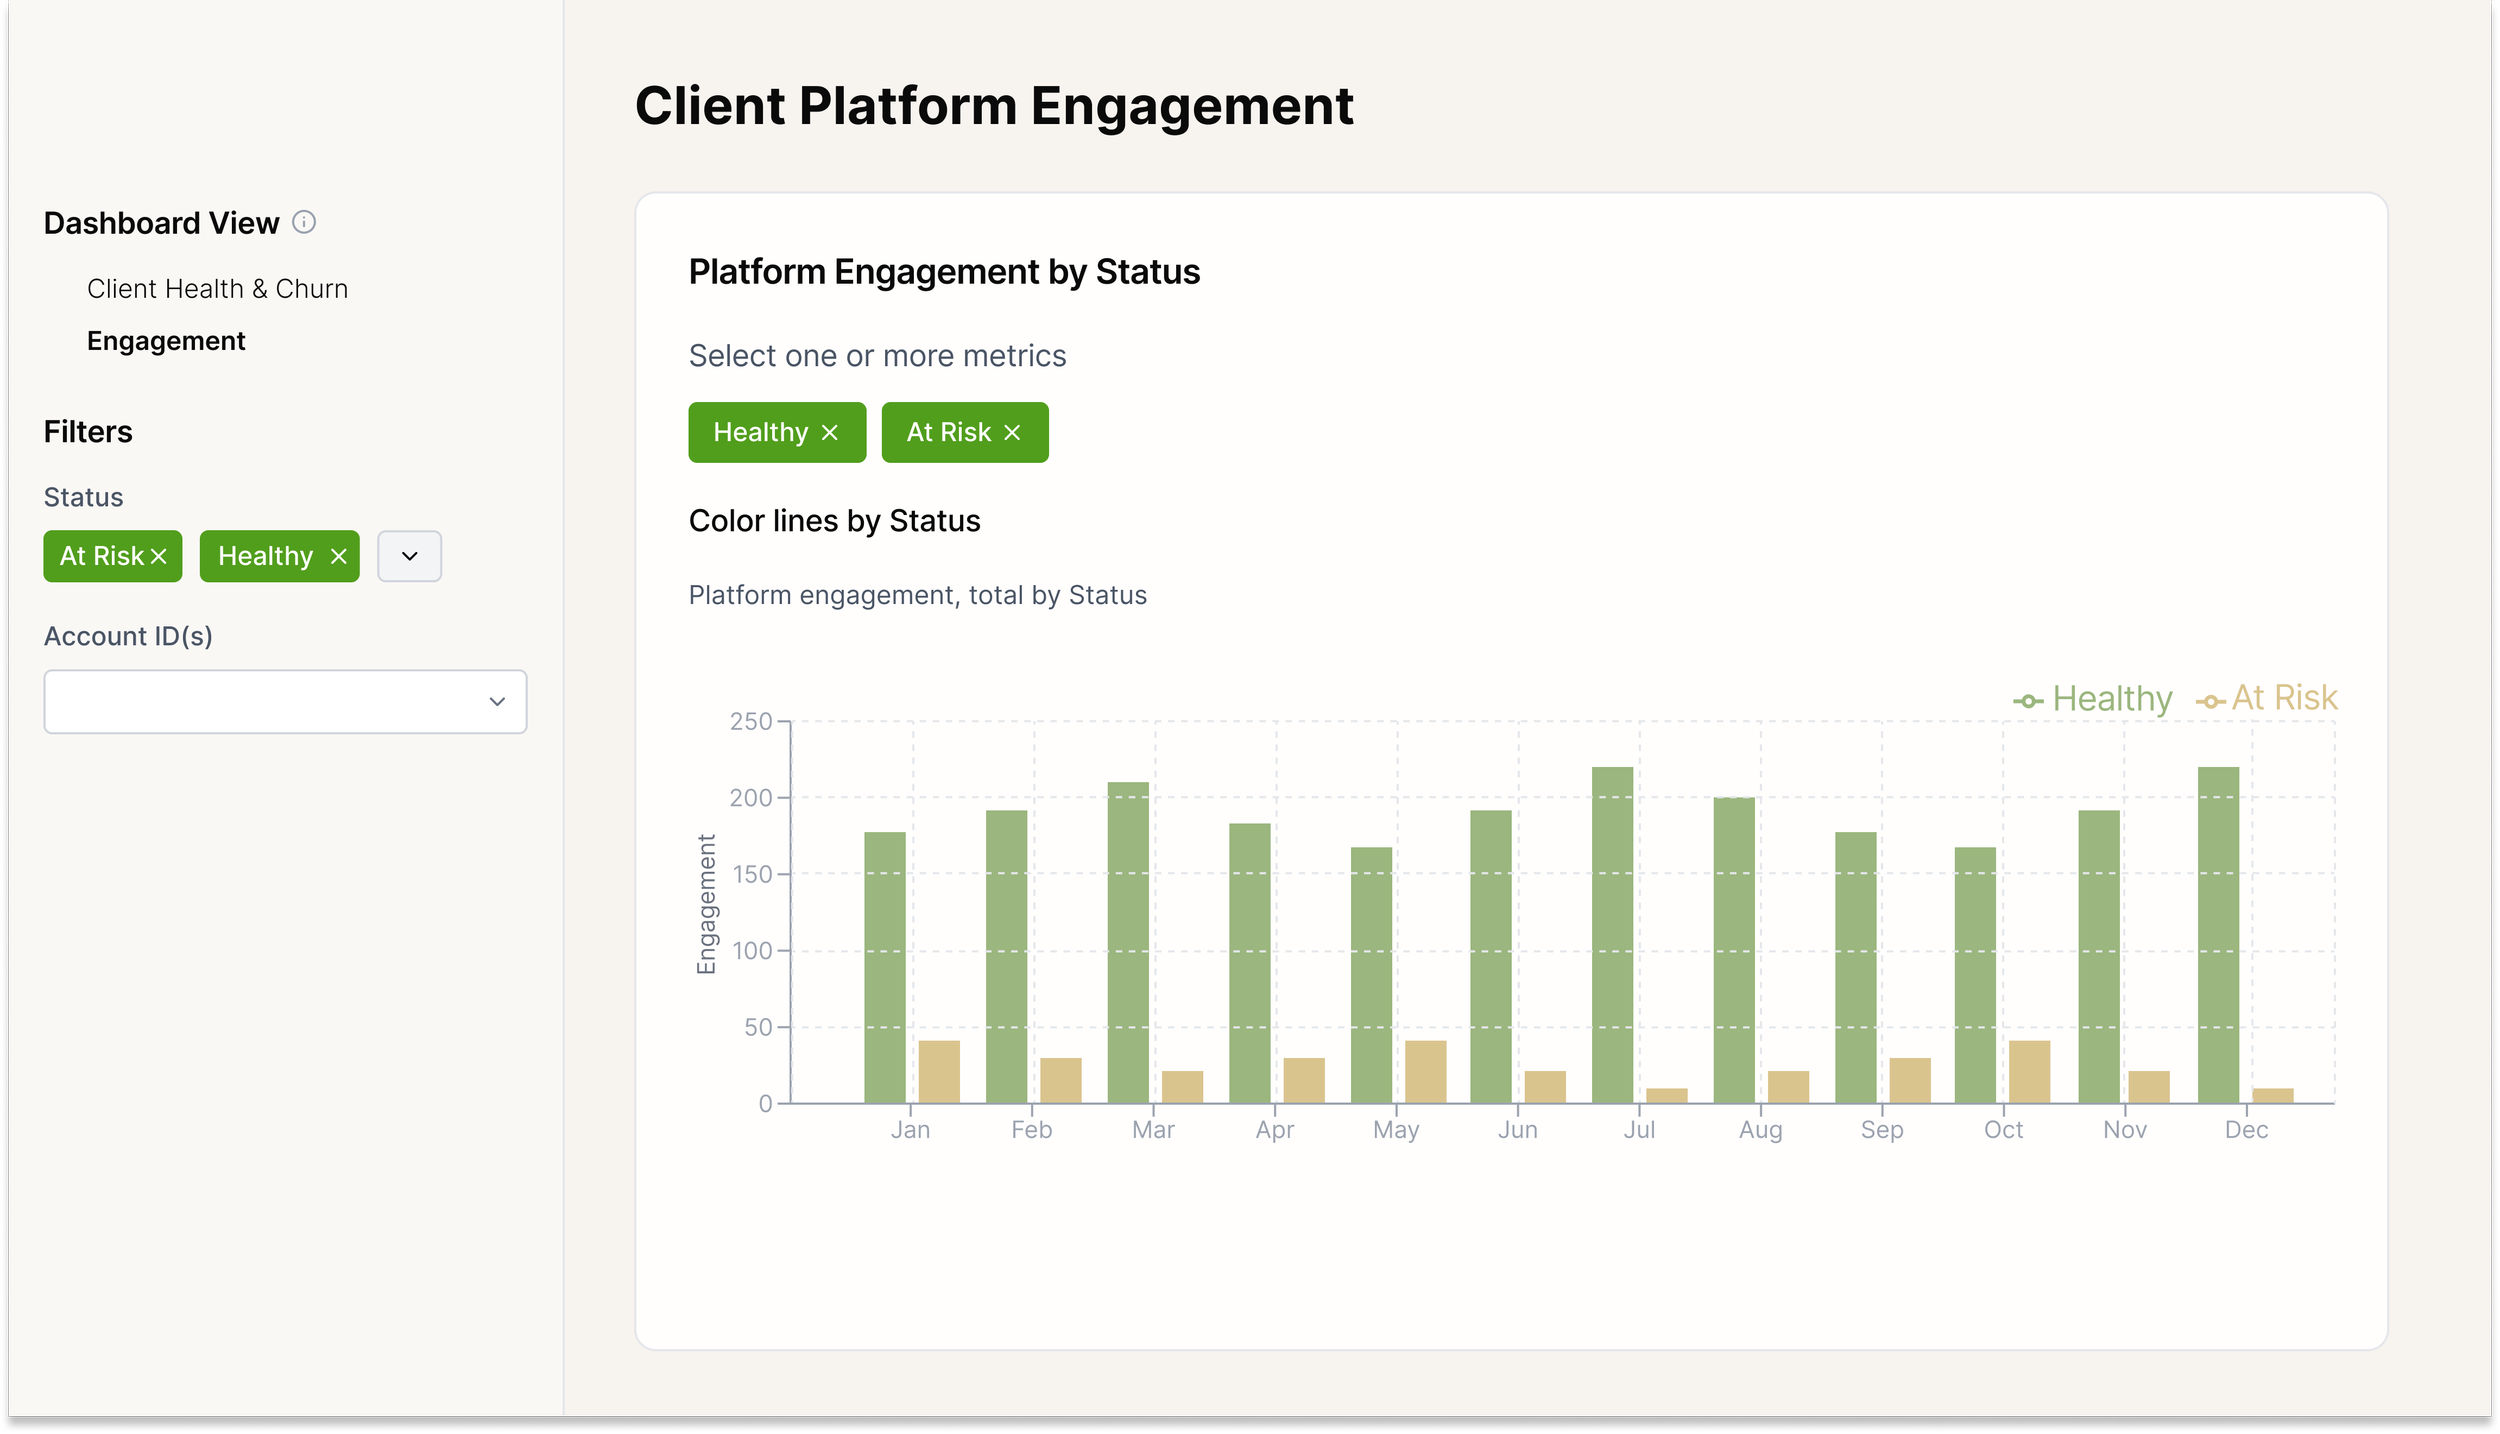
The system produces the following indices:
Total engagement and per-user engagement, each split across:
all users, external (client) users, and internal users. It also calculates
Momentum features
Engagement trend versus a rolling three-month average
Month-over-month change in active product areas
Month-over-month change in unique visitors
Results
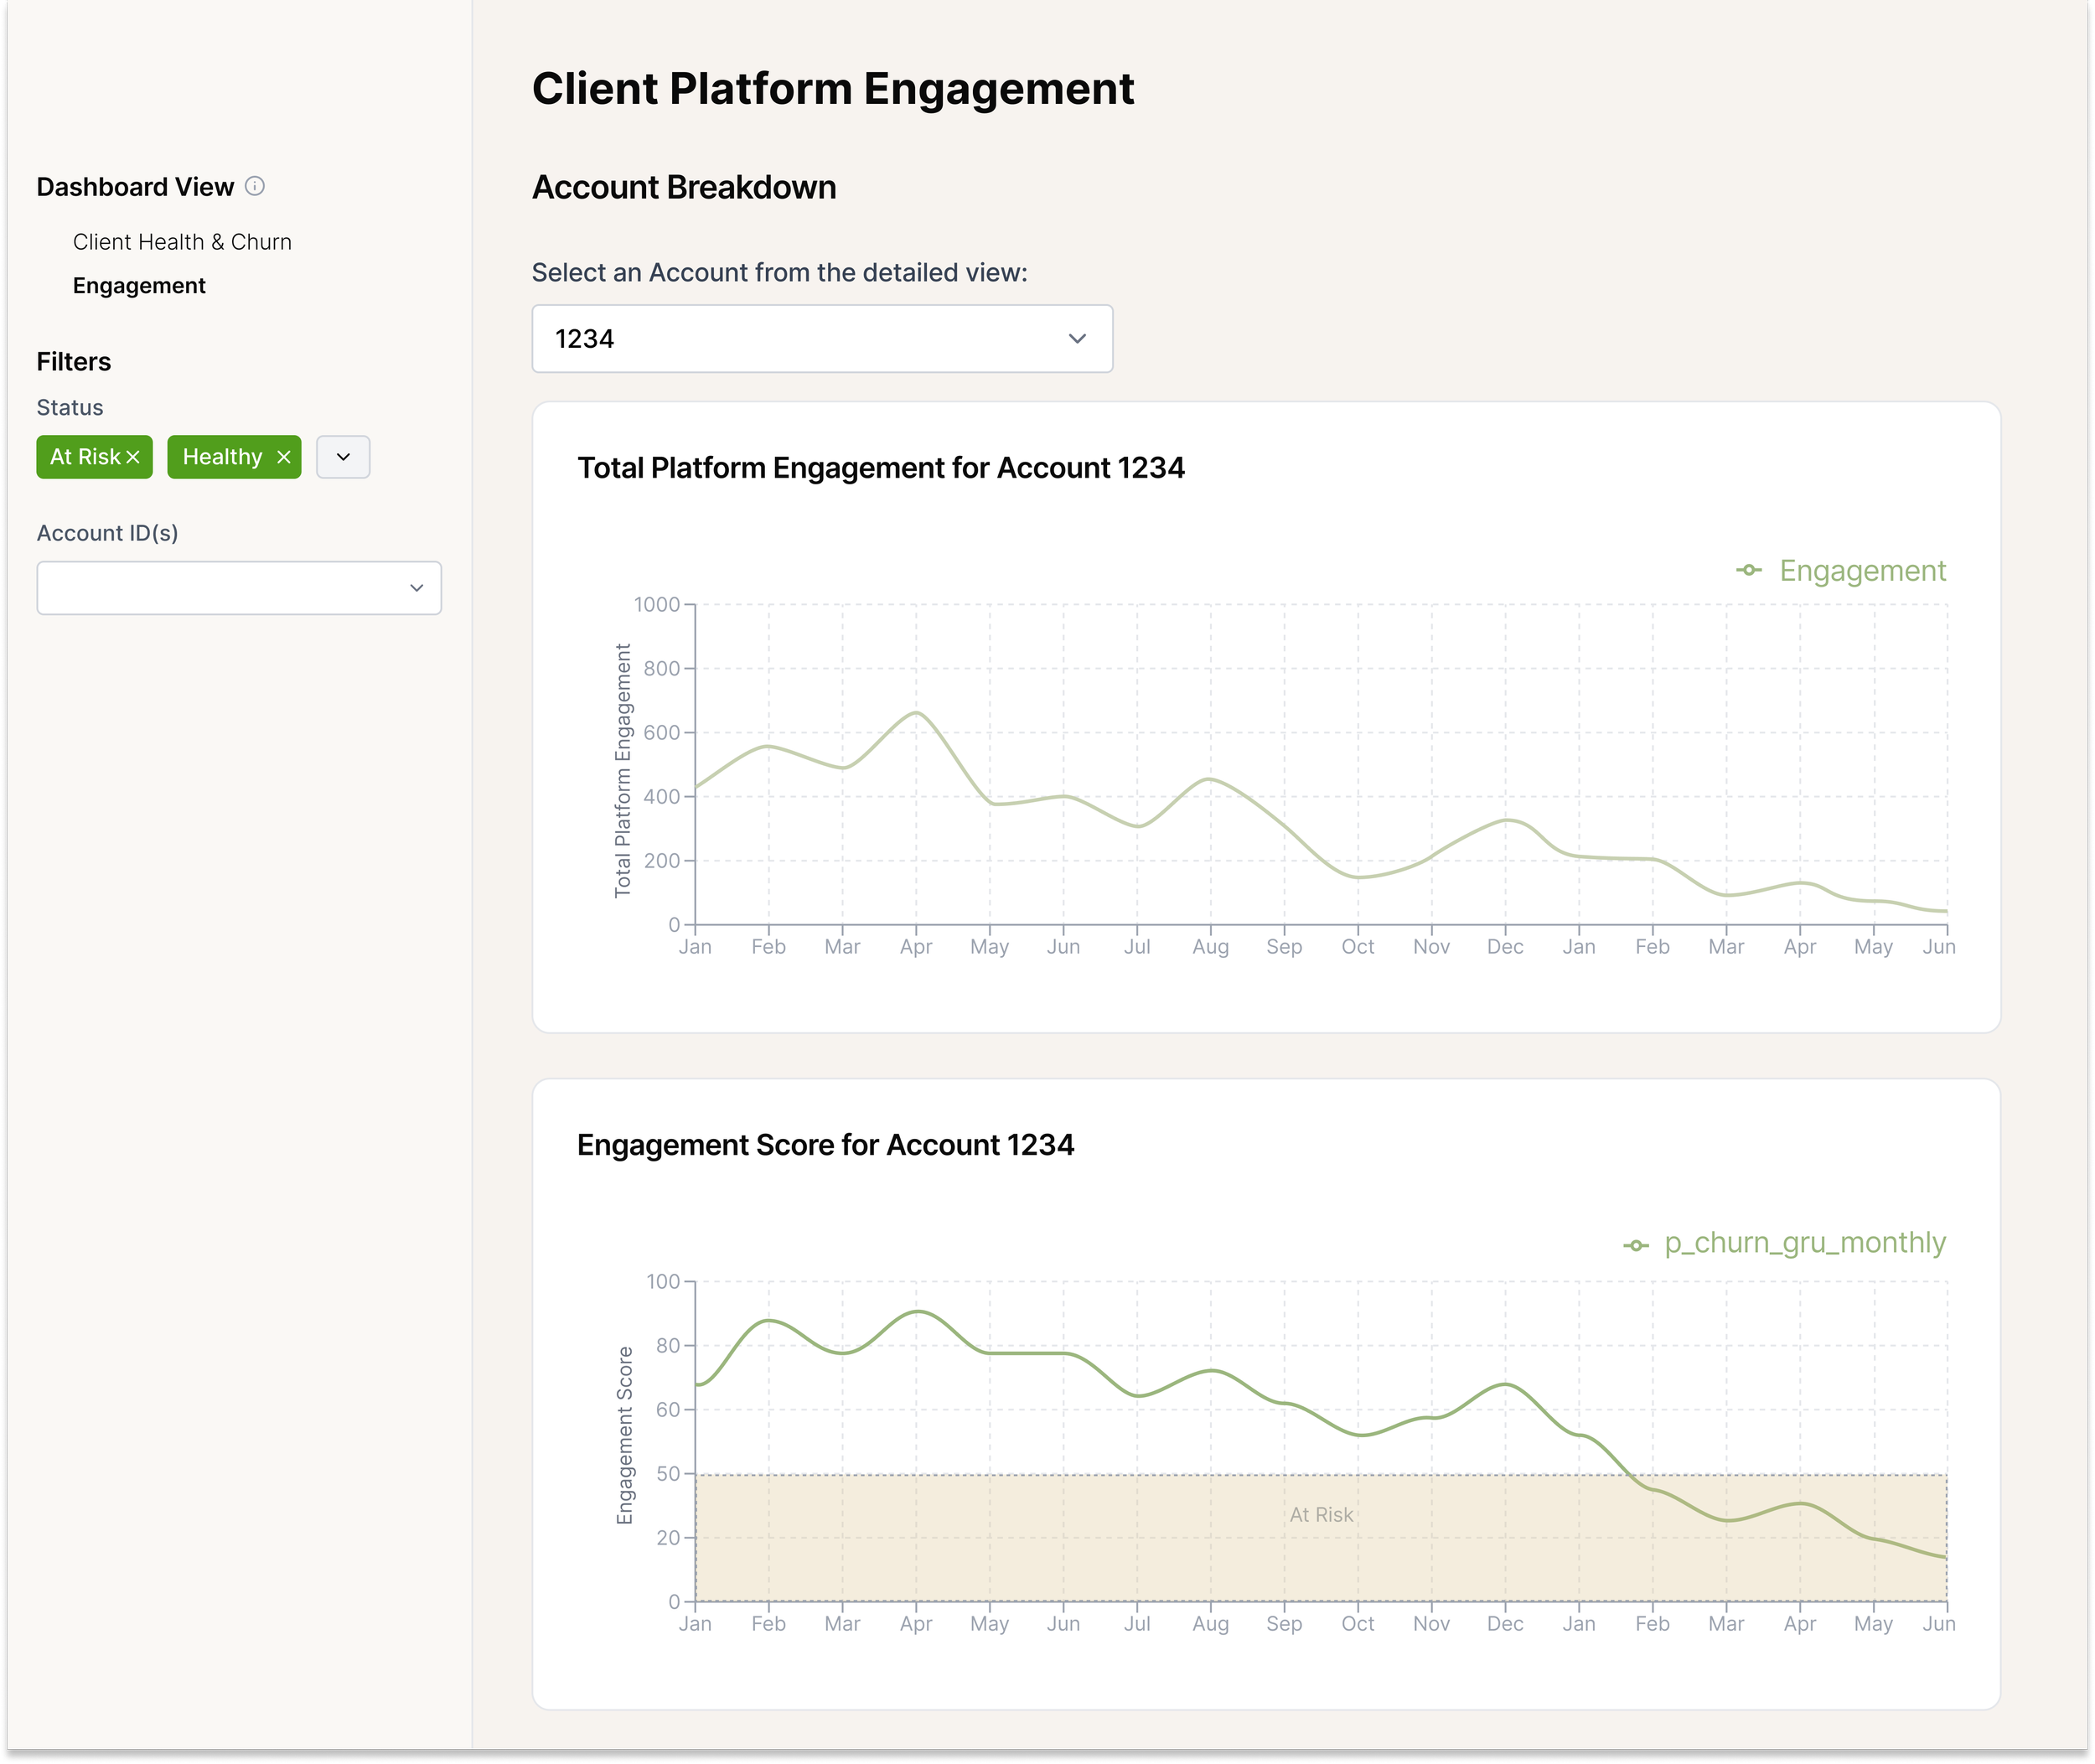
The score gives account teams a proactive tool for client retention that didn't exist before. Instead of waiting for a renewal conversation to surface adoption concerns, teams can now identify clients with declining scores or negative momentum months in advance and intervene with targeted outreach or enablement support.
The percentile-based scoring model means comparisons are fair across the full client base, a 200-seat enterprise and a 10-seat SMB are evaluated on the same relative scale. The per-user indices in particular surface clients who look engaged in aggregate but where individual usage is thin, a pattern that's often a precursor to churn.
The automated pipeline reduced what was previously an ad hoc, multi-hour manual process to a single script execution. It's repeatable quarter over quarter with no rework, and because each step is modular, individual components can be updated, new product area mappings, additional date ranges, different source segments, without touching the rest of the system.